
Short answer: Qualitative risk analysis rates likelihood and impact with descriptive scales such as low, medium and high. Quantitative risk analysis estimates them in numbers, usually expected financial loss per year. Qualitative is faster and easier to communicate; quantitative better supports cost-benefit decisions. Most SMBs start qualitative and quantify only their largest risks.
Related guides:
- Seven risk assessment methodologies
- A comprehensive guide to using a risk assessment matrix
- How to conduct a HIPAA risk assessment for compliance
Key takeaways
- NIST SP 800-30 Rev. 1 recognizes three assessment approaches: quantitative, qualitative and semi-quantitative. Each has documented strengths and weaknesses.
- Qualitative analysis is quick and readable, but different assessors can reach very different results.
- Quantitative analysis supports cost-benefit choices, but its precision is only as good as its inputs.
- HHS says the HIPAA Security Rule does not prescribe a specific risk analysis methodology and that an entity may use qualitative, quantitative or combined methods.
- Whatever you choose, define the scales, document the reasoning and apply the method consistently. That consistency is what auditors and buyers look for.
What is the difference between quantitative and qualitative risk analysis?
The difference is how you express likelihood and impact: in words and ranked categories (qualitative) or in numbers such as frequencies and currency (quantitative).
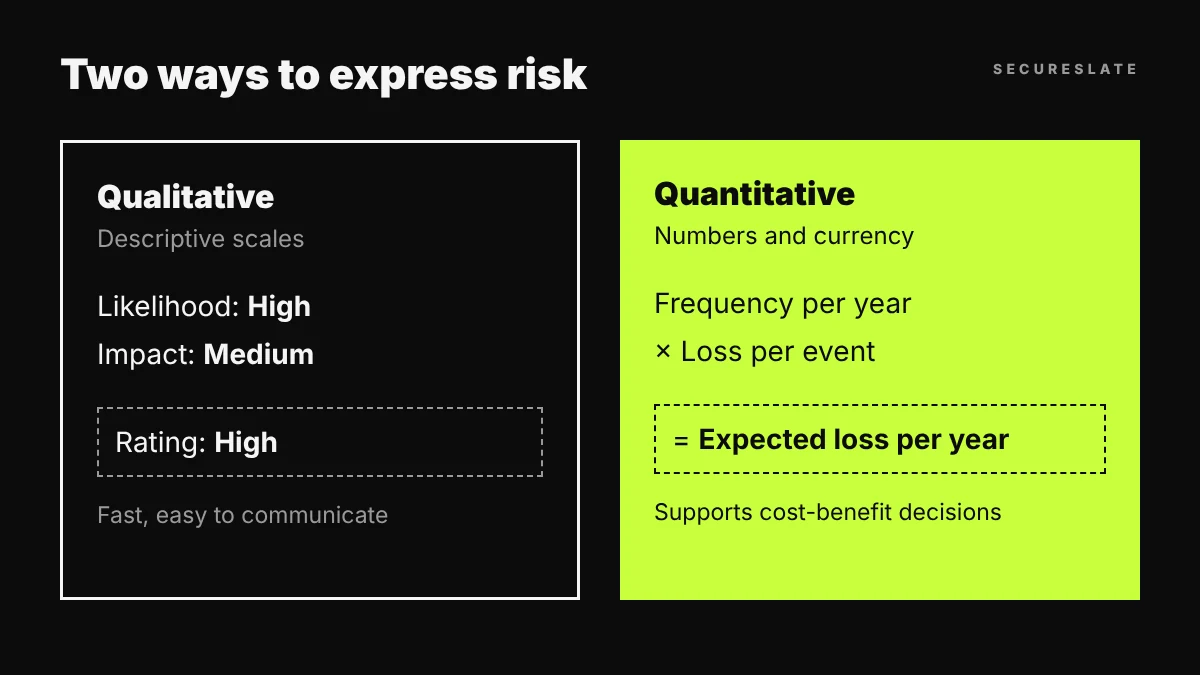
| Qualitative | Quantitative | |
|---|---|---|
| Inputs | Expert judgment against defined scales | Loss data, frequency estimates, ranges |
| Output | A rating such as High, Medium or Low | A number such as expected loss per year |
| Speed | Fast; workshops and interviews | Slower; needs data gathering and modelling |
| Best for | Broad risk registers, early programs | Big-ticket decisions, budget trade-offs |
| Main weakness | Results vary by assessor | Can look precise while resting on guesses |
NIST SP 800-30 makes the same trade-off explicit. It says quantitative assessment "most effectively supports cost-benefit analyses of alternative risk responses", while qualitative assessment "supports communicating risk results to decision makers."
How does qualitative risk analysis work?
You rate each risk's likelihood and impact on a short descriptive scale, then combine the two ratings, usually in a matrix, to rank risks.
A typical process:
- Define the scales. Write what each level means. For example, a "High" impact might mean an outage over one business day or exposure of regulated data. Vague labels are the root of most inconsistent ratings.
- Identify risks. Pair threats with the assets and weaknesses they could exploit.
- Rate likelihood and impact. Use a small group of people who know the system, not one person working alone.
- Combine and rank. Plot results on a risk matrix to set priorities.
- Record rationale. Write one or two sentences explaining each rating so the next reviewer can challenge or reuse it.
The weakness is spread. NIST notes that with qualitative methods "different experts relying on their individual experiences could produce significantly different assessment results", and that the small range of values makes it harder to separate risks that land in the same cell.
How does quantitative risk analysis work?
You estimate how often a loss event is likely to happen and how much it would cost, then multiply to get an expected loss you can compare with the cost of controls.
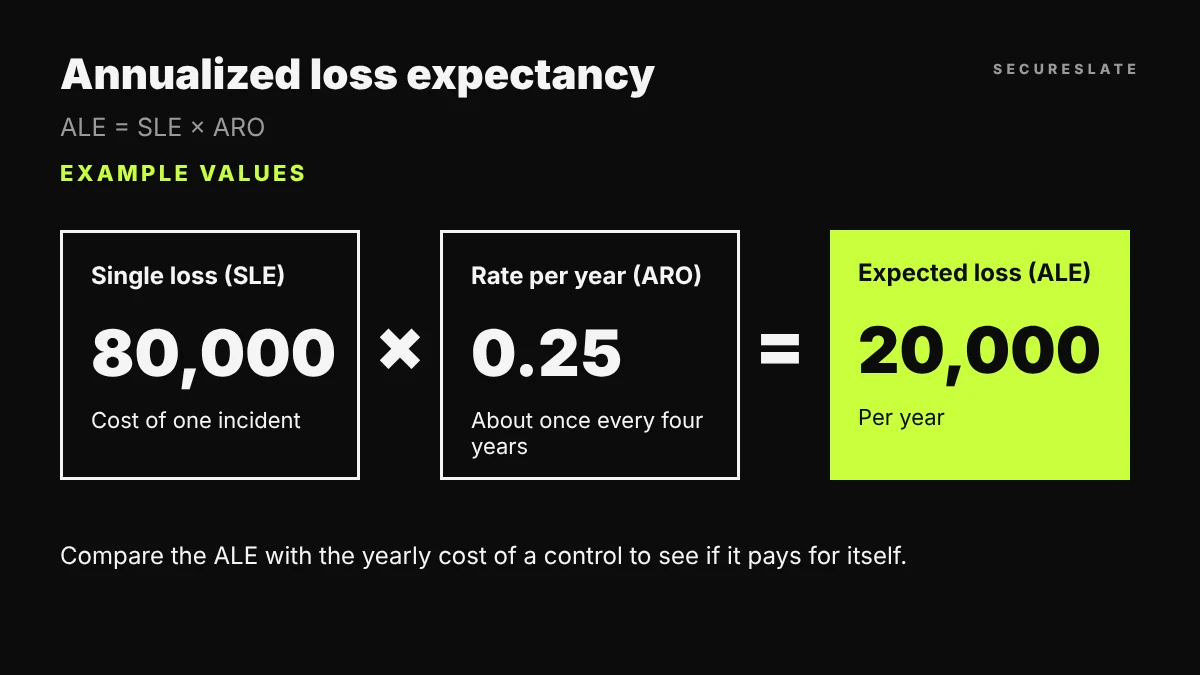
The simplest model is annualized loss expectancy:
- Single loss expectancy (SLE): the estimated cost of one occurrence.
- Annualized rate of occurrence (ARO): how many times per year you expect it.
- Annualized loss expectancy (ALE) = SLE × ARO.
A worked example with illustrative numbers: if one ransomware incident on a file server would cost an estimated 80,000 in recovery and downtime, and you expect it roughly once every four years (ARO of 0.25), the ALE is 20,000 per year. A control costing 5,000 a year that cuts the likelihood in half lowers the ALE to 10,000, so it is worth more than it costs.
More mature programs use ranges and simulations instead of single numbers. The Open FAIR standards from The Open Group, which the Open Group describes as the official, vendor-neutral definition of FAIR, break risk into loss event frequency and loss magnitude so each estimate can be reasoned about separately.
The catch, as NIST puts it, is that "the rigor of quantification is significantly lessened when subjective determinations are buried within" the assessment. A precise-looking dollar figure built on a guess is still a guess.
Where does semi-quantitative analysis fit?
Semi-quantitative analysis uses numeric scores, such as 1 to 5 or 1 to 10, mapped to defined qualitative descriptions, so you can rank risks more finely without building full loss models.
For example, likelihood 4 might mean "expected within the next year" and impact 3 might mean "material customer disruption or regulator notification." Multiplying gives a score of 12 that sits above a 9 and below a 16, which is easier to sort than "Medium-High."
NIST SP 800-30 notes that this approach "can provide the benefits of quantitative and qualitative assessments", but warns it inherits the same weakness: subjective inputs dressed as numbers. In our experience it is the most common choice for SaaS risk registers because it scales across dozens of risks with modest effort.
Which method should an SMB or HealthTech team use?
Start with a qualitative or semi-quantitative register for breadth, then quantify the few risks where a decision depends on the numbers.
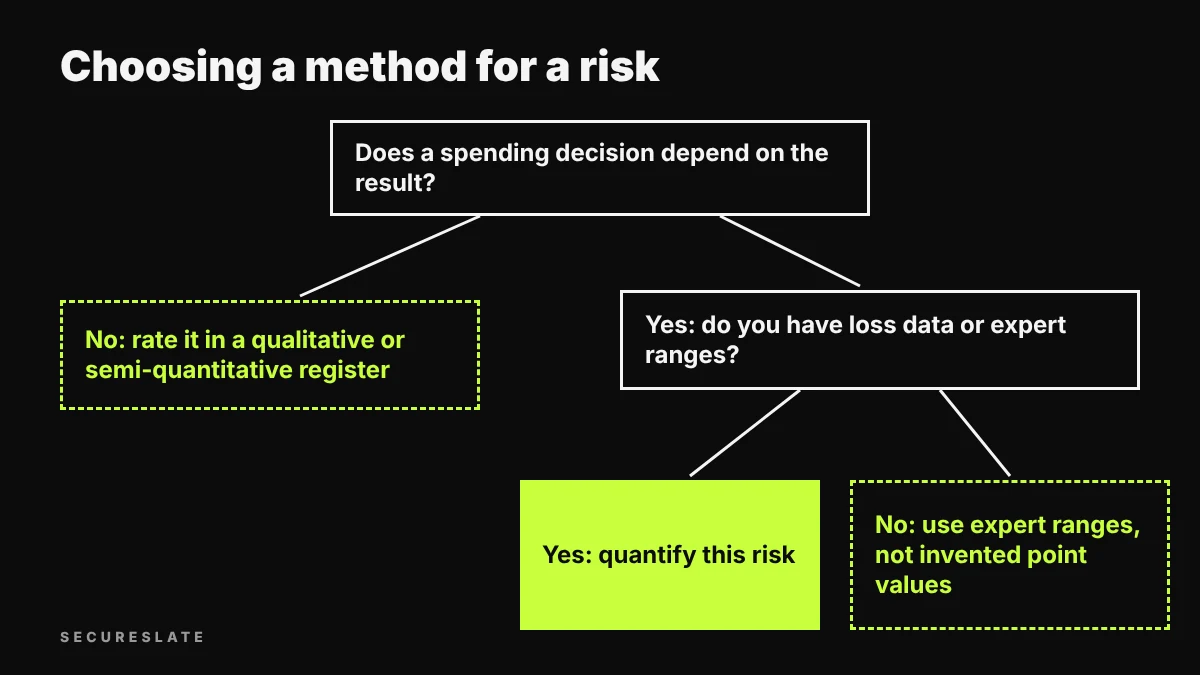
Use these questions:
- Is a spending decision riding on it? If leadership must choose between controls, insurance or accepting a risk, a quantitative estimate makes the trade-off clearer.
- Do you have reasonable data? Incident history, vendor contract values, downtime costs and breach response quotes make quantification realistic. Without them, ranges from informed experts are better than invented point values.
- Who is the audience? Boards and finance teams respond well to currency. Engineers and auditors usually need the ranked register and the reasoning behind it.
- How many risks are there? Quantifying 80 risks is rarely worth it. Quantifying the top five often is.
For HealthTech companies, the risks most often worth quantifying are exposure of patient data, extended outages of clinical-facing services and failures at critical vendors, because those drive contract, insurance and incident response decisions.
Do HIPAA, SOC 2 or ISO 27001 require a specific method?
No widely used framework forces one method, but each expects your method to be defined and applied consistently.
- HIPAA. The Security Rule requires covered entities and business associates to conduct "an accurate and thorough assessment of the potential risks and vulnerabilities" to ePHI. HHS's guidance on risk analysis states that the Security Rule "does not prescribe a specific risk analysis methodology" and that an entity "may use either a qualitative or quantitative method or a combination of the two methods." Our HIPAA risk assessment guide covers the required scope.
- NIST. SP 800-30 presents all three approaches and leaves the choice to the organization.
- SOC 2 and ISO 27001. Both expect a documented risk assessment process. In our experience, auditors focus on whether your criteria are defined, whether you followed them and whether results drive risk treatment, not on which scale you picked.
What mistakes make either method unreliable?
Most failures come from undefined criteria and missing follow-through, not from the choice of method.
- Labels without definitions. "High" means different things to different people unless you write it down.
- One assessor. A single person's view is the fastest route to the inconsistency NIST warns about.
- False precision. Reporting an ALE to the dollar when the inputs are rough guesses misleads decision makers. Show ranges.
- No link to treatment. A rating that never changes a decision is paperwork. Connect each high risk to a treatment and owner in your risk register.
- No re-rating. Re-assess after major changes, incidents and new vendors, not only once a year.
How SecureSlate helps
SecureSlate's risk management workflows let you run either method, or both, in one register:
- Risk management with configurable likelihood and impact scales, owners, treatments and review dates.
- Multi-framework control mapping so treatments link to controls that also count for SOC 2, ISO 27001 and HIPAA.
- Vendor risk management to bring third-party risks into the same register.
- Audit management to show auditors your method, ratings and follow-up in one place.
Start your free SecureSlate trial
FAQ
Is quantitative risk analysis more accurate than qualitative?
Not automatically. Quantitative results are more precise in form, but their accuracy depends on the quality of the inputs. Rough guesses turned into currency can be less reliable than a carefully reasoned qualitative rating.
Can we combine qualitative and quantitative risk analysis?
Yes, and many teams do. A common pattern is a qualitative or semi-quantitative register for all risks, with quantitative analysis for the few risks where a budget or insurance decision depends on the numbers. HHS explicitly allows a combination for HIPAA risk analysis.
What is a semi-quantitative risk assessment?
It uses numeric scores tied to written descriptions, such as likelihood 1 to 5 and impact 1 to 5, to rank risks more finely than High, Medium and Low without building full financial models.
Which method do auditors prefer?
In our experience, auditors care less about the method than about consistency. They want defined criteria, evidence that you applied them, and proof that ratings led to risk treatment decisions.
Disclaimer (legal note)
This article is for general information only and is not legal, regulatory or professional advice. Requirements vary by framework, industry and jurisdiction. Consult qualified advisors for your specific obligations.
Need compliance without the complexity?
SecureSlate automates ISO 27001, SOC 2, GDPR, HIPAA, and more. Built for growing teams. See it in action.
Find compliance gaps in 30 seconds
